Combo Strategy 123 Reversal & Bill Williams. AC with Signal Line This is combo strategies for get a cumulative signal.
First strategy
This System was created from the Book "How I Tripled My Money In The
Futures Market" by Ulf Jensen, Page 183. This is reverse type of strategies.
The strategy buys at market, if close price is higher than the previous close
during 2 days and the meaning of 9-days Stochastic Slow Oscillator is lower than 50.
The strategy sells at market, if close price is lower than the previous close price
during 2 days and the meaning of 9-days Stochastic Fast Oscillator is higher than 50.
Second strategy
This indicator plots the oscillator as a histogram where blue denotes
periods suited for buying and red . for selling. If the current value
of AO (Awesome Oscillator) is above previous, the period is considered
suited for buying and the period is marked blue. If the AO value is not
above previous, the period is considered suited for selling and the
indicator marks it as red.
You can make changes in the property for set calculating strategy MA, EMA, WMA
WARNING:
- For purpose educate only
- This script to change bars colors.
在腳本中搜尋"the strat"
Efficient PriceTrading The Movements That Matters
Inspired by the Price Volume Trend indicator the Efficient Price aim to create a better version of the price containing only the information a trend trader must need.
Calculation
This indicator use the Efficiency Ratio as a smoothing constant, it is calculated as follow :
ER = abs(change(close,length))/sum(abs(change(close)),length)
The goal of the Efficiency Ratio is to show if the market is trending or ranging.If ER is high then the market is considered to be trending, if ER is low then the market is considered to be ranging.
Then the Efficient Price is calculated :
EP = cum(change(close)*ER)
When the price is trending, the indicator will show movements of the price with unchanged volatility, but if the price is not trending then the indicator will flatten those movements.Think of this indicator as both a filter and a compressor and the Efficient Price as some kind of threshold.
The Efficient Price As Input For Indicators/Strategies
If the indicator show the movement of the trending price, it can be interesting to use it as input in order to reduce the number of false signals in a strategy.
We will test 2 MACD strategy provided by tradingview, one using the closing price (In Red) and one with the efficient price (In White) as input
with both the following parameters :
fastLength = 50
slowlength = 200
MACDLength = 20
length = 50
Where length is the parameter of the Efficient Price.A spread of 2 pips is used.
Without Efficient Price : 26.88% of profitability, 69 pips of profit.
With Efficient Price : 38.46% of profitability, 336 pips of profit.
The difference of profitability is of 11.58%, the strategy with the Efficient Price made few trades and its equity have a lower variance than the equity of the MACD strategy using closing price.
Smoothed Version
It is possible to smooth the indicator output by using the following code :
EP = cum(change(close,length)*ER)
Hope you enjoy
For any questions/demands feel free to pm me, i would be happy to help you

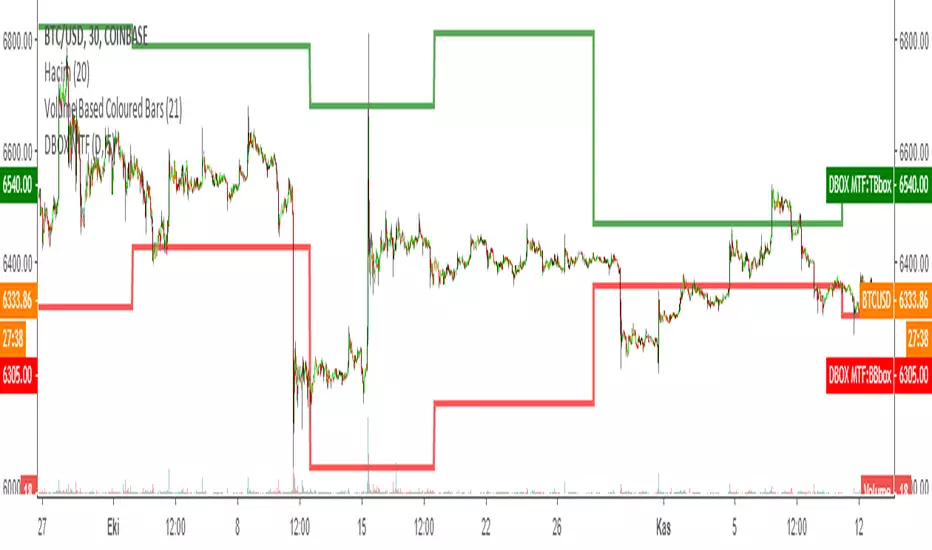
DARVAS BOX MTFMULTIPLE TIME FRAME VERSION OF DARVAS BOX:
You can view different time frame values of Darvas Box levels on any chart
What Is the Darvas Box?
The Darvas Box strategy was developed by Nicholas Darvas. Aside from being a well known dancer, he began trading stock in the 1950s. Based on his success in trading, he was approached to write a book on his strategy. The book, “How I Made $2,000,000 in the Stock Market,” outlines his rather simple approach … simple once you understand the basic concepts and rationale of the strategy.
Darvas Box is an indicator that simply draws lines along highs and lows, and then adjusts them as new highs and lows form. The indicator is available on many trading platforms, such as Thinkorswim. Traders may wish to draw their own boxes though, based on recent highs and lows; Darvas was able to do so (based on telegram quotes) more than half a century ago.
Darvas Box Rules
I shall not follow advisory services.
I shall be cautious of broker advice.
I shall ignore Wall Street sayings or truisms, no matter how ancient or revered.
I shall only trade stocks on major exchanges with adequate volume .
I shall not listen to (or trade off of) rumors or tips, no matter how well researched they may sound.
I will use a sound strategy instead of gamble…I must study this strategy (originally this approach was fundamental analysis , which didn’t work for him, so he developed his Darvas Box trading method).
I will hold one position for longer, as opposed to juggling a bunch of positions for a short period of time.
Darvas looked for increasing volume when selecting stocks to trade; this alerted him to stocks that were being accumulated and were likely to see strong trends.
Darvas believed in buying stocks that presented an upper box limit breakout, but also had an upward Earnings trend. This was especially the case when the major indexes had experienced a decline.
When an upper box limit is broken, buy. From his book, the entry price was usually about 1 to 2% above the upper box limit.
If you enter a trade and the price proceeds to drop out of the new box, and back into the old box, exit the trade.
Entry and stop loss orders should be set in advance, so trades aren’t missed and risk is controlled.
Place, and trail the stop loss order to below the low of the most recent box. This initial stop loss was pretty tight, because Darvas assumed when a price broke out of an old box, it was entering a new box. Therefore, the stop was placed just below the high of old box which was just broken (low of new box).
Record trades, including reasons why you entered and exited.
General conditions of the market must favor buying. Don’t buy stocks when the major indexes are in a bear market, or when volume is flat or declining.
If you are stopped out, but the price moves back into the higher box again providing another buy signal, buy again, using the same stop loss location.
Since the stop is being trailed up, more funds can be added on each consecutive breakout.
The Bottom Line
Nicholas Darvas was a dancer, but committed a great deal of time to developing and then mastering his stock trading method. It’s a trend following method based on breakouts to higher boxes. Risk is controlled by placing a stop below new higher boxes as they form. During choppy conditions the strategy won’t be profitable. This is why Darvas also attempted to only trade stocks with increasing volume and rising Earnings . Trading his method requires a lot of discipline, but can produce big profits when strong trends develop.
source: traderhq.com
Creator: Nicholas DARVAS
Here's the link to a complete list of all my indicators:
tr.tradingview.com
Şimdiye kadar paylaştığım indikatörlerin tam listesi için: tr.tradingview.com
DARVAS BOX by KIVANÇ fr3762What Is the Darvas Box?
The Darvas Box strategy was developed by Nicholas Darvas. Aside from being a well known dancer, he began trading stock in the 1950s. Based on his success in trading, he was approached to write a book on his strategy. The book, “How I Made $2,000,000 in the Stock Market,” outlines his rather simple approach … simple once you understand the basic concepts and rationale of the strategy.
Darvas Box is an indicator that simply draws lines along highs and lows, and then adjusts them as new highs and lows form. The indicator is available on many trading platforms, such as Thinkorswim. Traders may wish to draw their own boxes though, based on recent highs and lows; Darvas was able to do so (based on telegram quotes) more than half a century ago.
Darvas Box Rules
I shall not follow advisory services.
I shall be cautious of broker advice.
I shall ignore Wall Street sayings or truisms, no matter how ancient or revered.
I shall only trade stocks on major exchanges with adequate volume .
I shall not listen to (or trade off of) rumors or tips, no matter how well researched they may sound.
I will use a sound strategy instead of gamble…I must study this strategy (originally this approach was fundamental analysis , which didn’t work for him, so he developed his Darvas Box trading method).
I will hold one position for longer, as opposed to juggling a bunch of positions for a short period of time.
Darvas looked for increasing volume when selecting stocks to trade; this alerted him to stocks that were being accumulated and were likely to see strong trends.
Darvas believed in buying stocks that presented an upper box limit breakout, but also had an upward Earnings trend. This was especially the case when the major indexes had experienced a decline.
When an upper box limit is broken, buy. From his book, the entry price was usually about 1 to 2% above the upper box limit.
If you enter a trade and the price proceeds to drop out of the new box, and back into the old box, exit the trade.
Entry and stop loss orders should be set in advance, so trades aren’t missed and risk is controlled.
Place, and trail the stop loss order to below the low of the most recent box. This initial stop loss was pretty tight, because Darvas assumed when a price broke out of an old box, it was entering a new box. Therefore, the stop was placed just below the high of old box which was just broken (low of new box).
Record trades, including reasons why you entered and exited.
General conditions of the market must favor buying. Don’t buy stocks when the major indexes are in a bear market, or when volume is flat or declining.
If you are stopped out, but the price moves back into the higher box again providing another buy signal, buy again, using the same stop loss location.
Since the stop is being trailed up, more funds can be added on each consecutive breakout.
The Bottom Line
Nicholas Darvas was a dancer, but committed a great deal of time to developing and then mastering his stock trading method. It’s a trend following method based on breakouts to higher boxes. Risk is controlled by placing a stop below new higher boxes as they form. During choppy conditions the strategy won’t be profitable. This is why Darvas also attempted to only trade stocks with increasing volume and rising Earnings . Trading his method requires a lot of discipline, but can produce big profits when strong trends develop.
source: traderhq.com
Creator: Nicholas DARVAS

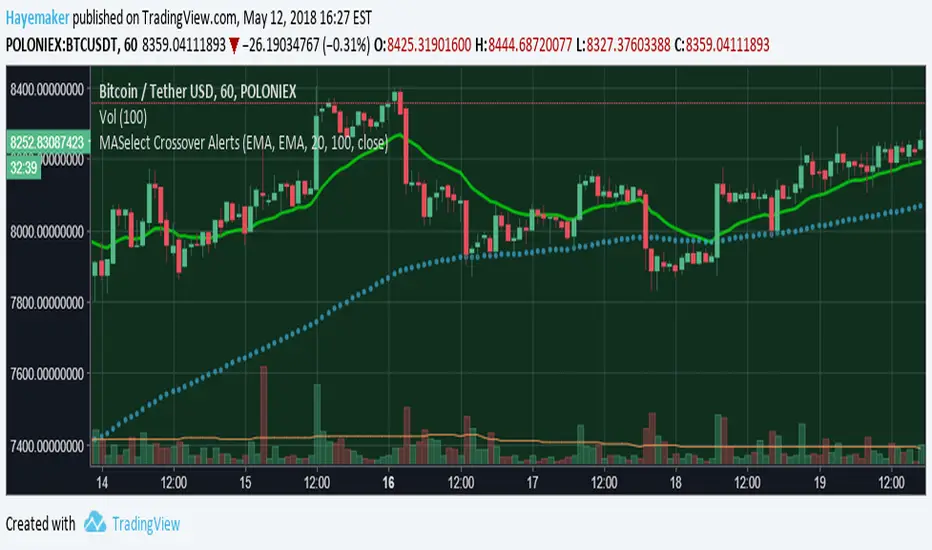
MASelect Crossover AlertsStudy for alerts, to be used with the MASelect Crossover Strat.
A simple crossover/crossunder strategy for beginners with options for 5 types of Moving Average. Use the strategy script to backtest and find your preferred Moving Average combinations and lengths.
Moving Average Cross and/or Bbands botHello TradingView and world!
This is one of our latest concepts for an actual bot builder. This script comes with a bunch of features that we're hoping will alleviate a lot of the stress and confusion around using and building strategies here on TV. Especially if the end-goal is to automate the strategies using Autoview.
This is a combination of 2 strategies, and gives you full control of each component within the script.
The 2 strategies are:
2 Moving Averages == if close is greater than moving average and moving average 1 is greater than moving average 2
Bolling Bands == if close is less than lower or greater than upper
Features / Settings included :
- Ability to change settings from a commodity market (default) to an altcoin or forex market.
- Backtest time period selector component
- Heiken Ashi Candles on/off
- Moving Average Strategy on/off
- Bollinger Bands Strategy on/off
- Both Moving Average settings can be adjusted
- Bollinger Bands length and multiplier can be adjusted.
- Pyramiding Greater Than, Equal To, or Less Than
- Trailing Stop with the ability to set a price in which the Trailing Stop activate
- Take Profit on/off and editable
- Stop Loss on/off and editable
- Margin Call on/off dependent on Leverage which is editable
- If pyramiding is used, the strategy will calculate and display your average on the chart
- Profit and Loss visuals added to the chart
You can watch a video here on how all the settings can be used and work together.
www.youtube.com
You can learn more about Autoview here:
autoview.with.pink
Get your invite and join us in slack here:
slack.with.pink

Heiken Ashi + Ichimoku Kinko Hyo StrategyHeikin-Ashi:
Instead of using the open-high-low-close (OHLC) bars like standard candlestick charts, it uses a modified formula. Out of which only following two are used in this strategy.
High = Max (High,Open,Close)
Low = Min (Low,Open, Close)
Ichimoku Kinko Hyo:
The Ichimoku Kinko Hyo system includes five kinds of signal, of which this strategy uses four signals i.e. Tenkan Sen / Kijun Sen Cross, price crosses the Kijun Sen, Chikou Span and Kumo. Although the Chikou Span, Senkou Span A and Senkou Span B (Kumo) are shifted into the past/future, these trigger signals enhances the strategy.
The Tenkan Sen, also known as the Turning or Conversion line, is a moving average of the highest high and lowest low over the last 9 periods in this strategy.
The Kijun Sen, also known as the Standard or Base line, is a moving average of the highest high and lowest low over the last 24 periods in this strategy.
The Chikou Span, also known as the Lagging line, is the closing price plotted 24 periods behind in this strategy.
The Senkou Span A, also known as the 1st leading line, is a moving average of the Tenkan Sen and Kijun Sen and is plotted 24 periods ahead in this strategy.
The Senkou Span B, also known as the 2nd leading line, is a moving average of the highest high and lowest low over the last 51 trading days is plotted 24 periods ahead in this strategy.
Hull MA-X + Ichimoku Kinko Hyo StrategyHull MA-X:
The Hull MA involves the weighted moving average ( WMA ) in its calculation.
First, calculate the WMA with period (n / 2) and multiply this by 2. Remember ‘n’ is the time period configurable based on the trader’s requirement.
Second, calculate the WMA for period “n” and subtract if from the first step. Thirdly, calculate the weighted moving average with period sqrt (n) using the data from the second step. You can take a look at the below formula:
Hull MA= WMA (2*WMA (n/2) − WMA (n)), sqrt (n))
The default setting is 12 periods in this strategy, fast Hull MA crossing slow Hull MA will generate a circle on charts.
Ichimoku Kinko Hyo:
The Ichimoku Kinko Hyo system includes five kinds of signal, of which this strategy uses four signals i.e. Tenkan Sen / Kijun Sen Cross, price crosses the Kijun Sen, Chikou Span and Kumo. Although the Chikou Span, Senkou Span A and Senkou Span B (Kumo) are shifted into the past/future, these trigger signals enhances the strategy.
The Tenkan Sen, also known as the Turning or Conversion line, is a moving average of the highest high and lowest low over the last 9 periods in this strategy.
The Kijun Sen, also known as the Standard or Base line, is a moving average of the highest high and lowest low over the last 24 periods in this strategy.
The Chikou Span, also known as the Lagging line, is the closing price plotted 24 periods behind in this strategy.
The Senkou Span A, also known as the 1st leading line, is a moving average of the Tenkan Sen and Kijun Sen and is plotted 24 periods ahead in this strategy.
The Senkou Span B, also known as the 2nd leading line, is a moving average of the highest high and lowest low over the last 51 trading days is plotted 24 periods ahead in this strategy.
As with most technical analysis methods, Ichimoku is likely to produce frequent conflicting signals in non-trending markets, So in addition to Ichimoku Kinko Hyo, the Hull MA is used, which is popular amongst some day traders, in combination it attempts to give an accurate signal by eliminating lags and improving the smoothness of the line.
The Hull MA Cross in combination with Ichimoku Kinko Hyo signals tries to give an accurate signal by eliminating lags and improve the smoothness of price activity. Please note that price trends can and do change often, so your readings of the charts and this trading system should be probabilistic, rather than predictive.
Ichimoku Kinko Hyo + HULL-MA_X + MacDThe Ichimoku Kinko Hyo system includes five kinds of signal, of which this strategy uses the most recent of ones i.e. Tenkan Sen / Kijun Sen Cross and price crosses the Kijun Sen. As the Chikou Span, Senkou Span A and Senkou Span B are shifted into the past/future, the trigger signals will be only be used for visual confirmation and not part of the strategy.
The Tenkan Sen, also known as the Turning or Conversion line, is a moving average of the highest high and lowest low over the last 9 periods in this strategy.
The Kijun Sen, also known as the Standard or Base line, is a moving average of the highest high and lowest low over the last 24 periods in this strategy.
The Chikou Span, also known as the Lagging line, is the closing price plotted 24 periods behind in this strategy.
The Senkou Span A, also known as the 1st leading line, is a moving average of the Tenkan Sen and Kijun Sen and is plotted 24 periods ahead in this strategy.
The Senkou Span B, also known as the 2nd leading line, is a moving average of the highest high and lowest low over the last 51 trading days is plotted 24 periods ahead in this strategy.
Moving average convergence divergence (MaCD) is a trend-following momentum indicator that shows the relationship between two moving averages of prices. The MaCD is calculated in this strategy by subtracting the 24-day exponential moving average (EMA) from the 12-day EMA. A nine-day EMA of the MACD, called the "signal line", aMaCD in this case, is then plotted on top of the MaCD. In this strategy, MaCD/ aMaCD Cross is functioning as a trigger for buy and sell signals.
As with most technical analysis methods, Ichimoku is likely to produce frequent conflicting signals in non-trending markets, So in addition to Ichimoku Kinko Hyo, the Hull MA is popular amongst some day traders, as the indicator which in combination with MaCD attempts to give an accurate signal by eliminating lags and improving the smoothness of the line.
Alan Hull, developed this moving average indicator and hence it’s called the Hull MA.
Now, let’s dissect how the Hull moving average is calculated.
The Hull MA involves the weighted moving average (WMA) in its calculation.
First, calculate the WMA with period (n / 2) and multiply this by 2. Remember ‘n’ is the time period configurable based on the trader’s requirement. The default setting is 12 periods in this strategy, fast Hull MA crossing slow Hull MA will generate a circle on charts.
Second, calculate the WMA for period “n” and subtract if from the first step. Thirdly, calculate the weighted moving average with period sqrt (n) using the data from the second step. You can take a look at the below formula:
Hull MA= WMA (2*WMA (n/2) − WMA (n)), sqrt (n))
The Hull MA Cross in combination with Tenkan Sen / Kijun Sen Cross and MaCD tries to give an accurate signal by eliminating lags and improve the smoothness of price activity. Please note that price trends can and do change often, so your readings of the charts and this trading system should be probabilistic, rather than predictive.

alert!!!!alerts work over values of plots on the chart. could not find a way to add an alert when a strategy is triggered.
so, i created an alert chart that uses the same conditions as the strategy(i published the example strat in my previous script). an alert chart should be mostly zero, but when the strat fires up, the alert = 1, and when the strat fires down, alert = -1. this way it's easy to check the chart for alerts.
but, if i'm looking at the cahrt and see the strat's arrows, what's the point? well, the point is that we can add alerts to this chart, to send emails, popup on screen, start screaming, whatever. so that now i don't actually need the chart in screen all the time :)
since this alert chart behaves so nice, values = to add an alert is just setting it's value >0.5, or value > -0.5 :)
note: aloert is not actually in the script, it has to be added manually using the button. if Pine has a way to add alerts programatically, i couldn't find it
Strategy Code Example - Risk Management*** THIS IS JUST AN EXAMPLE OF STRATEGY RISK MANAGEMENT CODE IMPLEMENTATION ***
For my own future reference, and for anyone else who needs it.
Pine script strategy code can be confusing and awkward, so I finally sat down and had a little think about it and put something together that actually works (i think...)
Code is commented where I felt might be necessary (pretty much everything..) and covers:
Take Profit
Stop Loss
Trailing Stop
Trailing Stop Offset
...and details how to handle the input values for these in a way that allows them to be disabled if set to 0, without breaking the strategy.exit functionality or requiring a silly amount of statement nesting.
Also shows how to use functions (or variables/series) to execute trade entries and exits.
Cheers!

Everyday 0003 _ MAC Pullback I recently posted a Moving Averge Crossover strategy for my Everyday project - a project I've given myself where I try to create one strategy everyday in between 15 minutes and 2 hours.
In the comments of my last published idea, user SignalTradersUK was very kind and suggested I try the following in my next study:
"i think your next study should be, to workout what to do after the Moving Average cross! If you look just on the chart you have posted, Price would appear to always come back to the levels where the 2 MA's cross and then go back in the direction of the crossing of the MA's. It's a great pull back strategy."
I'm really just beginning to learn about coding strategies so I'm not 100% sure I correctly understood his suggestion.
I admit I had difficulties wrapping my head around how to do this.
Anyway, the result is a strategy which runs alongside the main Moving Average Crossover.
'The Algorithm'
When the fast and slow MA cross the strategy traces back 40 days to find a swing low.
This swing low and the price at the MA cross is used to calculate a fib 1.272 extension.
The price at this 1.272 extension is used to place a Pullback short order.
Since we're shorting a bull trend, a tight stop is used.
If the pullback reaches down to the fib 0.618 we take profit (close the short).
Like I said, I don't know if I correctly understood SignalTradersUK feedback, but I really appreciate the
feedback and advice!
As always I'm hoping to learn from the community, so all feedback, corrections and advice is very welcome!
Thanks!
/pbergden

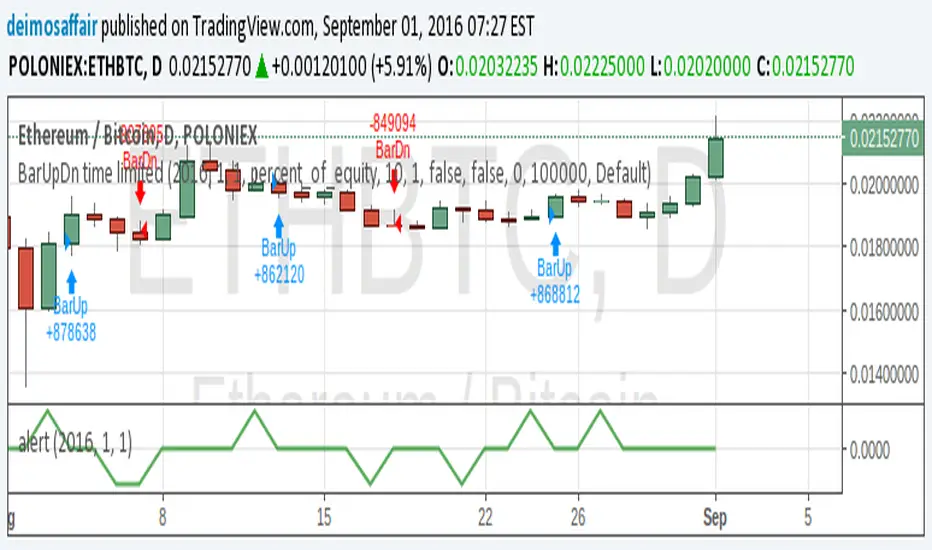
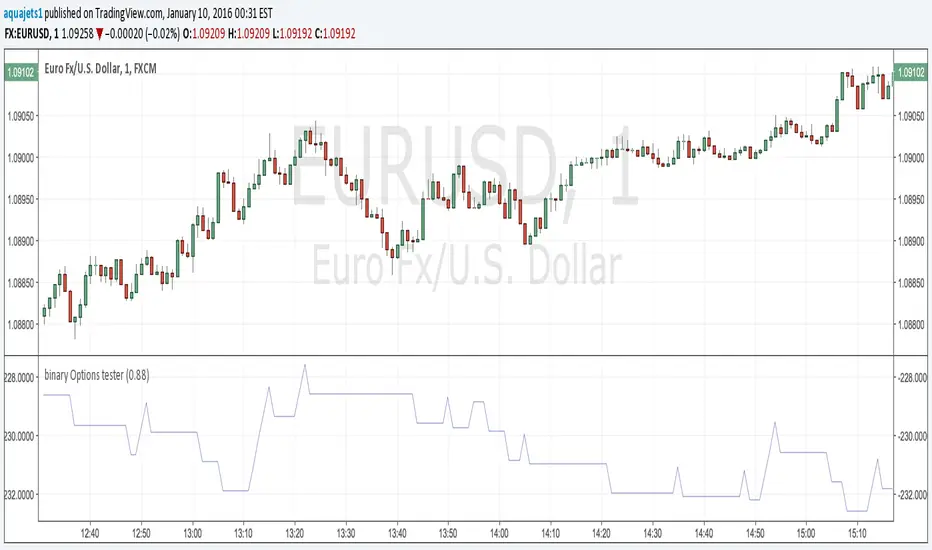
Binary Options Strategy Testing ScriptThis is a script for testing binary options trading strategies. To test a strategy, modify the 'go_down' or 'go_up' booleans. These SHOULD NOT access any current values (for example, 'ohlc4' or 'close '), or the backtesting will not be an accurate representation of the forward values.
Modify the fraction_return input to be the return rate of the option on success. This is assumed to be a true 100 or 0 option- i.e. if the choice is not correct, there is a 100% loss.
The strategy in place is merely an example, and as you can see, has a very negative rate of return when implemented as a strategy.
Please comment in your code if you use this in any future posts. Thanks!
Outsidebar vs Insidebar, Illusion Strategy (by ChartArt)WARNING: This strategy does not work! Please don't trade with this strategy
I'm sharing this strategy for the following three educational reasons:
1. You can easily find 100% strategies, but if they only seem to work 100% on one asset, they actually don't work at all. Therefore never backtest your strategy only on one asset, especially forward testing is useless, because it tends to repeat the old patterns. Your strategy has to work on as many different assets as possible.
2. The pyramiding of orders can have an impact on the strategy. In this case if you manually change the strategy settings by increasing it from 1 to 100 pyramiding orders changes the percent profitable on "UKOIL" monthly from 100% to 90% profitable. On other assets you can see very different results. Allowing much more pyramiding orders in this case results in opening orders where the background color highlights appear.
3. The Tradingview backtest beta version currently does not close the last open trade during the backtest. In this case going long on "UKOIL" near the top in 2011 as this strategy did would result in a big loss in 2015. But since the trade is still open and not canceled out by a new short order it still appears as if this strategy works 100% profitable. Which it doesn't.

[AutoView] MovingAvg Cross - Video AttachedThere is nothing special or spectacular about this script. It's your standard Moving Average Cross Strategy. It is actually a built in script everyone has access to already. I only changed some of the settings and flipped the orders.
The reason I actually published this, is because people have been asking me what the best way to find the best settings for a strategy. So I made a YouTube video showing people how I personally do it. I took this built in strategy and within 5 minutes took it from a net profit loss and profit factor of 0.5 to a net profit win with a profit factor of 3-5.
Of course this is only on the 1 minute candles, so forward testing the strategy is a must as I do not recommend straight up taking this and trading it.
You can watch the video here:
www.youtube.com
Hope this helps everyone speed up their back testing and fine tuning their strategies.

How to automate this strategy for free using a chrome extension.Hey everyone,
Recently we developed a chrome extension for automating TradingView strategies using the alerts they provide. Initially we were charging a monthly fee for the extension, but we have now decided to make it FREE for everyone. So to display the power of automating strategies via TradingView, we figured we would also provide a profitable strategy along with the custom alert script and commands for the alerts so you can easily cut and paste to begin trading for profit while you sleep.
Step 1:
You are going to need to download the Chrome Extension called AutoView. You can get the extension for free by following this link: bit.ly ( I had to shorten the link as it contains Google and TV automatically converts it to a symbol)
Step 2: Go to your chrome extension page, and under the new extension you'll see a "settings" button. In the setting you will have to connect and give permission to the exchange 1broker allowing the extension to place your orders automatically when triggered by an alert.
Step 3: Setup the strategy and custom script for the alerts in TradingView. The attached script is the strategy, you can play with the settings yourself to try and get better numbers/performance if you please.
This following script is for the custom alerts:
//@version=2
study("4All-Alert", shorttitle="Alerts")
src = close
len = input(4, minval=1, title="Length")
up = rma(max(change(src), 0), len)
down = rma(-min(change(src), 0), len)
rsi = down == 0 ? 100 : up == 0 ? 0 : 100 - (100 / (1 + up / down))
rsin = input(5)
sn = 100 - rsin
ln = 0 + rsin
short = crossover(rsi, sn) ? 1 : 0
long = crossunder(rsi, ln) ? 1 : 0
plot(long, "Long", color=green)
plot(short, "Short", color=red)
Now that you have the extension installed, the custom strategy and alert scripts in place, you simply need to create the alerts.
To get the alerts to communicate with the extension properly, there is a specific syntax that you will need to put in the message of the alert. You can find more details about the syntax here : gist.github.com
For this specific strategy, I use the Alerts script, long/short greater than 0.9 on close.
In the message for a long place this as your message:
Long
c=order b=short
c=position b=short l=200 t=market
b=long q=0.01 l=200 t=market tp=13 sl=25
and for the short...
Short
c=order b=long
c=position b=long l=200 t=market
b=short q=0.01 l=200 t=market tp=13 sl=25
If you'll notice in my above messages, compared to the strategy my tp and sl (take profit and stop loss) vary by a few pips. This is to cover the market opens and spread on 1broker. You can change the tp and sl in the strategy to the above and see that the overall profit will not vary much at all.
I hope this all makes sense and it is enough to not only make some people money, but to show the power of coming up with your own strategy and automating it using TradingView alerts and the free Chrome Extension AutoView.
ps. I highly recommend upgrading your TradingView account so you have access to back testing and multiple alerts.
There is really no reason you won't cover the cost and then some on a monthly basis using the tools provided.
Best of luck and happy trading.
Note: The extension currently allows for automation on 2 exchanges; 1broker and Okcoin. If you do not have accounts there, we'd appreciate you signing up using our referral links.
www.okcoin.com
1broker.com

RSI Momentum ScalperOverview
The "RSI Momentum Scalper" is a Pine Script v5 strategy crafted for trading highly volatile markets, with a special focus on newly listed cryptocurrencies. This strategy harnesses the Relative Strength Index (RSI) alongside volume analysis and momentum thresholds to pinpoint short-term trading opportunities. It supports both long and short trades, managed with customizable take profit, stop loss, and trailing stop levels, which are visually plotted on the chart for easy tracking.
Why I Created This Strategy
I developed the "RSI Momentum Scalper" because I was seeking a reliable trading strategy tailored to newly listed, highly volatile cryptocurrencies. These assets often experience rapid price fluctuations, rendering traditional strategies less effective. I aimed to create a tool that could exploit momentum and volume spikes while managing risk through adaptable exit parameters. This strategy is designed to address that need, offering a flexible approach for traders in dynamic crypto markets.
How It Works
The strategy utilizes RSI to identify momentum shifts, combined with volume confirmation, to trigger long or short entries. Trades are controlled with take profit, stop loss, and trailing stop levels, which adjust dynamically as the price moves in your favor. The trailing stop helps lock in profits, while the plotted exit levels provide clear visual cues for trade management.
Customizable Settings
The script is highly customizable, allowing you to adjust it to various market conditions and trading styles. Here’s a brief overview of the key settings:
Trade Mode: Select "Both," "Long Only," or "Short Only" to determine the trade direction.
(Default: Both)
RSI Length: Sets the lookback period for the RSI calculation (2 to 30).
(Default: 8)
A shorter length increases RSI sensitivity, suitable for volatile assets.
RSI Overbought: Defines the upper RSI threshold (60 to 99) for short entries.
(Default: 90)
Higher values signal stronger overbought conditions.
RSI Oversold: Defines the lower RSI threshold (1 to 40) for long entries.
(Default: 10)
Lower values indicate stronger oversold conditions.
RSI Momentum Threshold: Sets the minimum RSI momentum change (1 to 15) to trigger entries.
(Default: 14)
Adjusts the sensitivity to price momentum.
Volume Multiplier: Multiplies the volume moving average to filter high-volume bars (1.0 to 3.0).
(Default: 1)
Higher values require stronger volume confirmation.
Volume MA Length: Sets the lookback period for the volume moving average (5 to 50).
(Default: 13)
Influences the volume trend sensitivity.
Take Profit %: Sets the profit target as a percentage of the entry price (0.1 to 10.0).
(Default: 4.15)
Determines when to close a winning trade.
Stop Loss %: Sets the loss limit as a percentage of the entry price (0.1 to 6.0).
(Default: 1.85)
Protects against significant losses.
Trailing Stop %: Sets the trailing stop distance as a percentage (0.1 to 4.0).
(Default: 2.55)
Locks in profits as the price moves favorably.
Visual Features
Exit Levels: Take profit (green), fixed stop loss (red), and trailing stop (orange) levels are plotted when in a position.
Performance Table: Displays win rate, total trades, and net profit in the top-right corner.
How to Use
Add the strategy to your chart in TradingView.
Adjust the input settings based on the cryptocurrency and timeframe you’re trading.
Monitor the plotted exit levels for trade management.
Use the performance table to assess the strategy’s performance over time.
Notes
Test the strategy on a demo account or with historical data before live trading.
The strategy is optimized for short-term scalping; adjust settings for longer timeframes if needed.

Order Block Volumatic FVG StrategyInspired by: Volumatic Fair Value Gaps —
License: CC BY-NC-SA 4.0 (Creative Commons Attribution–NonCommercial–ShareAlike).
This script is a non-commercial derivative work that credits the original author and keeps the same license.
What this strategy does
This turns BigBeluga’s visual FVG concept into an entry/exit strategy. It scans bullish and bearish FVG boxes, measures how deep price has mitigated into a box (as a percentage), and opens a long/short when your mitigation threshold and filters are satisfied. Risk is managed with a fixed Stop Loss % and a Trailing Stop that activates only after a user-defined profit trigger.
Additions vs. the original indicator
✅ Strategy entries based on % mitigation into FVGs (long/short).
✅ Lower-TF volume split using upticks/downticks; fallback if LTF data is missing (distributes prior bar volume by close’s position in its H–L range) to avoid NaN/0.
✅ Per-FVG total volume filter (min/max) so you can skip weak boxes.
✅ Age filter (min bars since the FVG was created) to avoid fresh/immature boxes.
✅ Bull% / Bear% share filter (the 46%/53% numbers you see inside each FVG).
✅ Optional candle confirmation and cooldown between trades.
✅ Risk management: fixed SL % + Trailing Stop with a profit trigger (doesn’t trail until your trigger is reached).
✅ Pine v6 safety: no unsupported args, no indexof/clamp/when, reverse-index deletes, guards against zero/NaN.
How a trade is decided (logic overview)
Detect FVGs (same rules as the original visual logic).
For each FVG currently intersected by the bar, compute:
Mitigation % (how deep price has entered the box).
Bull%/Bear% split (internal volume share).
Total volume (printed on the box) from LTF aggregation or fallback.
Age (bars) since the box was created.
Apply your filters:
Mitigation ≥ Long/Short threshold.
Volume between your min and max (if enabled).
Age ≥ min bars (if enabled).
Bull% / Bear% within your limits (if enabled).
(Optional) the current candle must be in trade direction (confirm).
If multiple FVGs qualify on the same bar, the strategy uses the most recent one.
Enter long/short (no pyramiding).
Exit with:
Fixed Stop Loss %, and
Trailing Stop that only starts after price reaches your profit trigger %.
Input settings (quick guide)
Mitigation source: close or high/low. Use high/low for intrabar touches; close is stricter.
Mitigation % thresholds: minimal mitigation for Long and Short.
TOTAL Volume filter: skip FVGs with too little/too much total volume (per box).
Bull/Bear share filter: require, e.g., Long only if Bull% ≥ 50; avoid Short when Bull% is high (Short Bull% max).
Age filter (bars): e.g., ≥ 20–30 bars to avoid fresh boxes.
Confirm candle: require candle direction to match the trade.
Cooldown (bars): minimum bars between entries.
Risk:
Stop Loss % (fixed from entry price).
Activate trailing at +% profit (the trigger).
Trailing distance % (the trailing gap once active).
Lower-TF aggregation:
Auto: TF/Divisor → picks 1/3/5m automatically.
Fixed: choose 1/3/5/15m explicitly.
If LTF can’t be fetched, fallback allocates prior bar’s volume by its close position in the bar’s H–L.
Suggested starting presets (you should optimize per market)
Mitigation: 60–80% for both Long/Short.
Bull/Bear share:
Long: Bull% ≥ 50–70, Bear% ≤ 100.
Short: Bull% ≤ 60 (avoid shorting into strong support), Bear% ≥ 0–70 as you prefer.
Age: ≥ 20–30 bars.
Volume: pick a min that filters noise for your symbol/timeframe.
Risk: SL 4–6%, trailing trigger 1–2%, distance 1–2% (crypto example).
Set slippage/fees in Strategy Properties.
Notes, limitations & best practices
Data differences: The LTF split uses request.security_lower_tf. If the exchange/data feed has sparse LTF data, the fallback kicks in (it’s deliberate to avoid NaNs but is a heuristic).
Real-time vs backtest: The current bar can update until close; results on historical bars use closed data. Use “Bar Replay” to understand intrabar effects.
No pyramiding: Only one position at a time. Modify pyramiding in the header if you need scaling.
Assets: For spot/crypto, TradingView “volume” is exchange volume; in some markets it may be tick volume—interpret filters accordingly.
Risk disclosure: Past performance ≠ future results. Use appropriate position sizing and risk controls; this is not financial advice.
Credits
Visual FVG concept and original implementation: BigBeluga.
This derivative strategy adds entry/exit logic, volume/age/share filters, robust LTF handling, and risk management while preserving the original spirit.
License remains CC BY-NC-SA 4.0 (non-commercial, attribution required, share-alike).

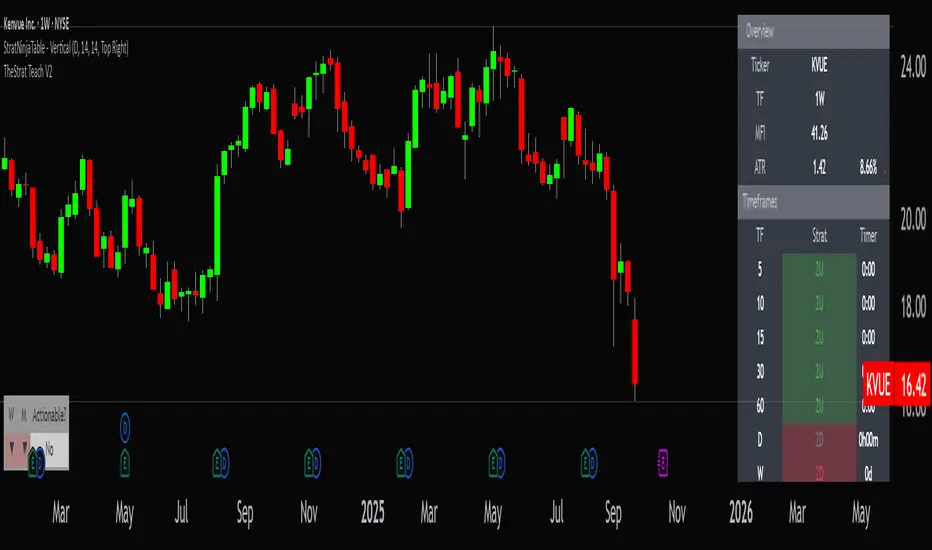
StratNinjaTable - VerticalA Pine Script v6 indicator that displays a vertical table with key The Strat data and supporting metrics.
✦ Table Structure:
Overview:
Ticker – the stock symbol.
TF – the chart’s main timeframe.
MFI – Money Flow Index with selectable timeframe.
ATR – Average True Range with color coding:
Green – below 3%.
Yellow – between 3% and 6%.
Red – above 6%.
Timeframes:
Displayed vertically (5m, 15m, 1H, D, W, M, etc.).
Each shows the current bar type according to The Strat (1, 2U, 2D, 3).
Text color reflects candle direction (green = close above open, red = close below open).
Includes a countdown timer to bar close.
Fundamentals:
Market Cap – in billions.
Sector – stock sector.
SMA20 Δ – distance from the 20-period SMA (in %).
Avg Volume (30d) – average 30-day volume (in millions).
✦ Adjustments Made:
Removed the Strat Pattern section completely.
Removed the DIR column – direction is now represented by Strat cell text color.
Reordered Overview section: Ticker → TF → MFI → ATR.
ATR now has three levels of coloring (Green/Yellow/Red) for >3% and >6%
The Maker StrategyDESCRIPTION
The Maker Strategy is a trend-following system built around exponential moving averages (EMAs). By analyzing the alignment of multiple EMAs, the strategy identifies strong bullish or bearish momentum and generates precise entry signals. This method is designed to capture sustained trends while filtering out sideways or noisy market conditions.
USER INPUTS :
• EMA 1 Length (Default: 30)
• EMA 2 Length (Default: 35)
• EMA 3 Length (Default: 40)
• EMA 4 Length (Default: 45)
• EMA 5 Length (Default: 50)
• EMA 6 Length (Default: 60)
LONG CONDITION :
A long signal is triggered when all EMAs are perfectly aligned in ascending order:
EMA1 > EMA2 > EMA3 > EMA4 > EMA5 > EMA6
SHORT CONDITION :
A short signal is triggered when all EMAs are perfectly aligned in descending order:
EMA1 < EMA2 < EMA3 < EMA4 < EMA5 < EMA6
WHY IT IS UNIQUE:
Unlike traditional EMA crossover systems that rely on just 2 or 3 moving averages, The Maker Strategy uses 6 EMAs in sequence. This ensures that trades are only taken when there is clear and strong market momentum. The approach minimizes false signals in ranging markets and focuses on capturing trends with higher probability setups.
HOW USER CAN BENEFIT FROM IT :
• Clear entry alerts for both long and short positions.
• Visual confirmation through candle coloring and EMA band fills.
• Works on multiple timeframes and instruments (stocks, forex, crypto, indices).
• Helps traders stay on the right side of the trend while avoiding whipsaws.
• A simple yet effective tool for those who want a disciplined, rules-based strategy.

RSI Momentum Trend MM with Risk Per Trade [MTF]This is a comprehensive and highly customizable trend-following strategy based on RSI momentum. The core logic identifies strong directional moves when the RSI crosses user-defined thresholds, combined with an EMA trend confirmation. It is designed for traders who want granular control over their strategy's parameters, from signal generation to risk management and exit logic.
This script evolves a simple concept into a powerful backtesting tool, allowing you to test various money management and trade management theories across different timeframes.
Key Features
- RSI Momentum Signals: Uses RSI crosses above a "Positive" level or below a "Negative" level to generate trend signals. An EMA filter ensures entries align with the immediate trend.
- Multi-Timeframe (MTF) Analysis: The core RSI and EMA signals can be calculated on a higher timeframe (e.g., using 4H signals to trade on a 1H chart) to align trades with the larger trend. This feature helps to reduce noise and improve signal quality.
Advanced Money Management
- Risk per Trade %: Calculate position size based on a fixed percentage of equity you want to risk per trade.
- Full Equity: A more aggressive option to open each position with 100% of the available strategy equity.
Flexible Exit Logic: Choose from three distinct exit strategies to match your trading style
- Percentage (%) Based: Set a fixed Stop Loss and Take Profit as a percentage of the entry price.
- ATR Multiplier: Base your Stop Loss and Take Profit on the Average True Range (ATR), making your exits adaptive to market volatility.
- Trend Reversal: A true trend-following mode. A long position is held until an opposite "Negative" signal appears, and a short position is held until a "Positive" signal appears. This allows you to "let your winners run."
Backtest Date Range Filter: Easily configure a start and end date to backtest the strategy's performance during specific market periods (e.g., bull markets, bear markets, or high-volatility periods).
How to Use
RSI Settings
- Higher Timeframe: Set the timeframe for signal calculation. This must be higher than your chart's timeframe.
- RSI Length, Positive above, Negative below: Configure the core parameters for the RSI signals.
Money Management
Position Sizing Mode
- Choose "Risk per Trade" to use the Risk per Trade (%) input for precise risk control.
- Choose "Full Equity" to use 100% of your capital for each trade.
- Risk per Trade (%): Define the percentage of your equity to risk on a single trade (only works with the corresponding sizing mode).
SL/TP Calculation Mode
Select your preferred exit method from the dropdown. The strategy will automatically use the relevant inputs (e.g., % values, ATR Multiplier values, or the trend reversal logic).
Backtest Period Settings
Use the Start Date and End Date inputs to isolate a specific period for your backtest analysis.
License & Disclaimer
© waranyu.trkm — MIT License.
This script is for educational purposes only and should not be considered financial advice. Trading involves significant risk, and past performance is not indicative of future results. Always conduct your own research and risk assessment before making any trading decisions.

BE-Fib Channel 2 Sided Trading█ Overview:
"BE-Fib Channel 2 Sided Trading" indicator is built with the thought of 2 profound setups named "Cup & Handle (C&H)" and "Fibonacci Channel Trading (FCT)" with the context of "day trading" or with a minimum holding period.
█ Similarities, Day Trading Context & Error Patterns:
While the known fact is that both C&H and FCT provide setups with lesser risk with bigger returns, they both share the similar "Base Pattern".
Note: Inverse of the above Image shall switch the setups between long vs short.
Since the indicator is designed for smaller time-frame candles, there may be instances where the "base pattern" does not visually resemble a Cup & Handle (C&H) pattern. However, patterns are validated using pivot points. The points labeled "A" and "C" can be equal or slightly slanted. Settings of the Indicator allows traders a flexibility to control the angle of these points to spot the strategies according to set conditions. Therefore, understanding the nuances of these patterns is crucial for effective decision-making.
█ 2 Sided Edge: FCT suggests to take trade closer to the yellow line to get better RR ratio. this leaves a small chance of doubt as to; what if price is intended to break the Yellow line thereby activating the C&H.
Wait for the confirmation is a Big FOMO with a compromised RR.
Hence, This indicator is designed to handle both the patterns based on the strength, FIFO and pattern occurring delay.
█ How to Use this Indicator:
Step 1: Enable the Show Sample Sensitivity option to understand the angle of yellow line shown in the sample image. By enabling this option, On the last bar you shall see 4 lines being plotted depicting the max angle which is acceptable for both long and short trades.
Note: Angle can be controlled via setting "Sensitivity".
Higher Sensitivity --> Higher Setup identification --> can lead to failed setups due to 2 sided trading.
Lower Sensitivity --> Lower Setup identification --> can increase the changes of being right.
Step 2: Adjust the look back & look forward periods which shall be used for identifying patterns.
Note: Smaller values can lead to more setups being identified but can hamper the performance of the indicator while increasing the chances of failures. larger values identifies more significant setup but leads to more waiting period thereby compromising on the RR.
Step 3: Adjust the Base Range.
Note: Smaller values can lead to more setups being identified but can hamper the performance of the indicator while increasing the chances of failures. larger values identifies more significant setup but leads to more Risk on play.
Step 4: set the Entry level for FCT & Set the SL for Both FCT & C&H and Target Reward ratio for C&H.
█ Features of Indicator & How it works:
1. Patterns are being identified using Pivot Points method.
2. Tracks & validates both the setups simultaneously on every candle and traded one at a time based on FIFO, New setups found in-between, Defined Entry Levels while on wait for the other pattern to get activated.
3. Alerts added for trade events.
4. FCT setups are generally traded with trailed SL level and increasing Target level on every completed bar. while C&H has the standard SL & TP level with no Trail SL option.
DISCLAIMER: No sharing, copying, reselling, modifying, or any other forms of use are authorized for our documents, script / strategy, and the information published with them. This informational planning script / strategy is strictly for individual use and educational purposes only. This is not financial or investment advice. Investments are always made at your own risk and are based on your personal judgement. I am not responsible for any losses you may incur. Please invest wisely.
Happy to receive suggestions and feedback in order to improve the performance of the indicator better.

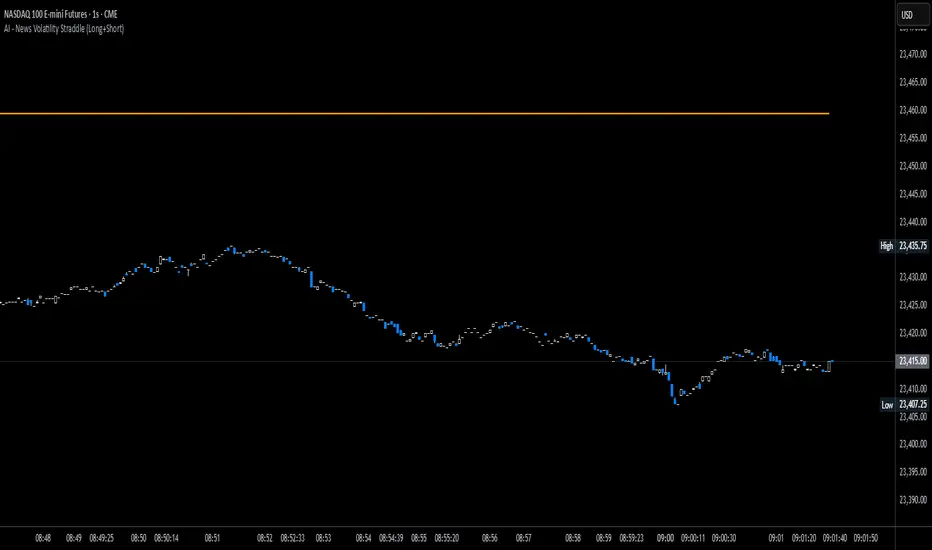
News Volatility Bracketing StrategyThis is a news-volatility bracketing strategy. Five seconds before a scheduled release, the strategy brackets price with a buy-stop above and a sell-stop below (OCO), then converts the untouched side into nothing while the filled side runs with a 1:1 TP/SL set the same distance from entry. Distances are configurable in USD or %, so it scales to the instrument and can run on 1-second data (or higher TF with bar-magnifier). The edge it’s trying to capture is the immediate, one-directional burst and liquidity vacuum that often follows market-moving news—entering on momentum rather than predicting direction. Primary risks are slippage/spread widening and whipsaws right after the print, which can trigger an entry then snap back to the stop.